
October Market Wrap – The Great Rotation
October was the month the market stopped being a one-stock story — or, more accurately, a seven-stock story. The headline indices split wide open: the Dow Jones was the lone standout at +1.76%, the Russell 2000 eked out +0.58%, and everything else finished red. The S&P 500 slipped 0.87%, the Nasdaq Composite fell 5.28%, and emerging markets got hammered for 8.04%, a rough month for anyone chasing international growth.
Under the hood, the sector tape tells the real story. Energy ran roughly 14% as the conflict in the Middle East kept crude bid, and defensive sectors led most of the rest of the board. Communication Services, on the other hand, fell more than 15%, and semiconductors stumbled hard after third-quarter earnings shifted the conversation from the promise of AI revenue to the sheer cost of building it. Style followed suit — Large-cap Value gained 4.4% while Large-cap Growth dropped 6.1%. That is a 10-point gap in a single month between the two sides of the same market.
The good news is that this was a rotation, not a retreat. The equal-weight S&P 500 rallied roughly 5% in the same month the cap-weighted index fell, and third-quarter GDP re-accelerated to a 3.4% annualized pace with blended earnings growth still running far above trend. When the average stock is doing fine while the giants digest their capex bills, that is a market broadening — uncomfortable for anyone holding only the winners of the last two years, but healthy.
From a tape perspective, it was a bumpy ride that ended with a nasty finish: the Nasdaq posted its worst day since June on the last Friday of the month and AI shares led the market lower again on Monday, even as the Fed held and bonds staged a powerful mid-month rally. The monthly numbers look orderly. The path certainly was not.
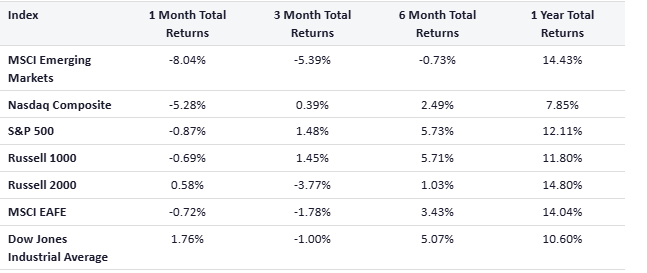
Trailing total returns through November 3, 2026. The one-month column runs from early October to early November, so it will not tie exactly to the calendar-month figures above.
Fixed Income & Treasury Yields
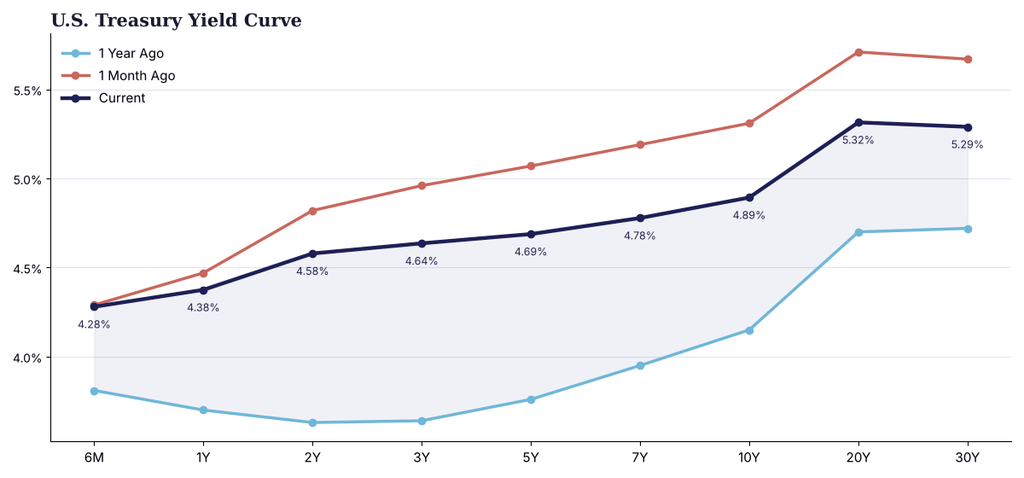
Bonds finally did their job. After the 10-year briefly spiked above 5.3% early in the month — a multi-decade high on an intraday basis — a mid-month flight to safety dragged yields lower across the curve. The 10-year finished October at 4.94%, down 35 basis points, and the 5-year fell the most at 38 basis points after spiking 60 in September. Everything from the 2-year out dropped roughly 30 basis points. The only exception was the very front end, where the 1-month ticked up as the market priced a December hike.
Set today’s curve against a month ago and you can see the rally in one picture: the whole curve has shifted down, with the 20-year about 40 basis points lower than where it sat in early October. Against a year ago, though, the curve is still far higher and far steeper — the 10-year is roughly 75 basis points above last November and the 30-year is north of 5.2%. That is a bond market that has stopped bracing for a crisis, but is still demanding to be paid for inflation and deficits.
Macro & Commodity Update
The labor market is cooling, and it is doing it noisily. The economy added just 22,000 jobs in September against a consensus near 84,000, and the unemployment rate rose a tenth to 4.2%. The Fed, meanwhile, held at 3.75%–4.00% on October 28 on a 10–2 vote — and both dissenters wanted a hike. Weak jobs, a hawkish committee, and a central bank that already hiked once this year is a combination I haven’t seen in a long time.
Inflation is the reason. Headline CPI rose 0.3 points to 3.70% in September and core climbed to 2.60%, while producer prices hit 6.30% year over year, the highest since late 2022. CME-style FedWatch gauges and prediction markets now put the odds of a 25 basis point hike on December 9 at roughly 75–80%. Housing is feeling it: the 30-year mortgage rate touched 7.40% intra-month, its highest since November 2023, and sat at 7.24% on October 29, even as existing home sales rose 1.53% and the median price slipped 2.38% to $417,500. ISM Manufacturing improved to 55.5.
In commodities, oil and the metals went opposite ways. Brent finished the month at $125.78, up 8.5%, and WTI rose 3.8% to $100.86 as Strait of Hormuz disruptions continued, though gas at the pump eased 2% to $4.41. Precious metals took a second straight beating — GLD fell 6.58% to $355.78 and SLV dropped 18.18% to $44.60 as yields spiked and then settled. Crypto gave back September’s gains: Bitcoin slid 7.7% to $77,233 and Ethereum fell 16.2% to $2,242.
Market Outlook – Relief Rally Meets a December Hike
The midterms are no longer a question mark — Democrats swept both the House and the Senate, a bigger rebuke than most of the polling suggested, and Wall Street’s first reaction was relief. In Wednesday trading the Dow jumped more than 1,200 points, or roughly 2.4%, on pace for its best day since April, while the S&P 500 and Nasdaq each gained around 1.4% and the VIX dropped about 16%. Futures had been lower overnight and reversed; the market took the certainty and the prospect of gridlock — Trump said he is willing to work with the opposition — as a brake on extreme fiscal and policy outcomes. Treasury yields slipped, with the 10-year near 4.90%, and the dollar weakened.
Under the hood, though, the reaction was anything but uniform — which is exactly the rotation theme from October continuing. Consumer staples hit a fresh all-time high, healthcare and renewables rallied, and communication services had their best day since April 2025, with the Magnificent 7 mostly higher. The losers were the names most exposed to data-center politics: neocloud stocks fell 6%, CoreWeave dropped more than 7%, chipmakers slipped, and Asian semiconductor stocks sold off hard overnight on worries that Democratic wins in Texas could mean more moratoriums on the AI buildout. Gold and silver also rose roughly 3% and 4%. As for history, the S&P 500 has been higher a year after each of the last eleven midterms, averaging roughly 14% — but BTIG’s Jonathan Krinsky points out that stocks usually run weak into midterms and strong afterward, and this year we have the opposite setup. One day of relief does not settle that debate.
Then come the data. The October jobs report lands Friday, November 6, and October CPI follows on the 10th. A hot CPI print cements the December 9 hike; a soft one puts real doubt in that roughly 75–80% probability. Either way the 10-year, near 4.90% after the election rally, is the pressure gauge to watch — a retest of 5.3% would be a problem for valuations with the S&P 500 still sitting below its late-October high and the Nasdaq still repairing after October.
The wildcard remains Iran. Oil jumped more than 10% in October, and the market has been trading as if Washington’s new balance of power calms the geopolitical temperature — that is an assumption, not a fact. Evercore ISI warns that kinetic escalation could push the S&P 500 down to 6,800 by year end. We are not pricing that in, but we are keeping energy and real assets in the portfolio precisely because they are the hedge if it happens. The rotation of October rewarded diversification. November should reward patience.
Bottom line: October proved that the market can break out of its old habits — value, defensives and the average stock carried the load while the AI leaders took a breather — and the post-midterm relief rally is a welcome start to November, but the AI trade is still searching for a floor and the jobs report and CPI are ahead. We are staying diversified, keeping our energy hedge, and letting the November 6 and November 10 data tell us how worried to be about December 9.