
June Market Wrap – Breadth Wins as Commodities Crack
June was one of those months where the headline index tells you almost nothing about what actually happened. The S&P 500 slipped 0.9% and the Nasdaq gave back 2.8%, so if you only glanced at the tape you’d think it was a forgettable month. Look under the hood, though, and the story flips — the small-cap Russell 2000 ripped 3.7% higher and the blue-chip Dow tacked on 2.7%. Leadership kept broadening out, exactly the rotation we’ve been flagging all year.
Sectors split almost evenly, with six of eleven finishing green. Industrials led the pack at +7.3% and Health Care wasn’t far behind at +6.6% — a distinctly un-2023 pairing at the top of the leaderboard. Energy lagged for a third straight month, down 5.0%, and Communication Services brought up the rear at -7.2% as the mega-cap growth trade cooled. When defensives and cyclicals both outrun the tech complex in the same month, that’s a market rewarding a much wider set of exposures than just the Magnificent names.
Zoom out to the halftime whistle and the broadening is even clearer. Through six months, emerging markets are up 24% and small caps 22.6%, both lapping the S&P 500’s 10.2%. Every major index we track is positive by more than 9%, and beneath the S&P, 315 of 500 constituents posted positive six-month total returns. This isn’t a handful of stocks carrying the tape — participation is real.
The other headline was commodities, and it wasn’t pretty. Gold cratered 11.7%, silver fell off a cliff at -21.8%, and oil kept unwinding its spring spike. From a tape perspective, June looked like a classic “sell what worked, rotate into what didn’t” month — with the added wrinkle of a genuine commodity flush.
Index Returns
| Index | 1 Month Total Returns | 3 Month Total Returns | 6 Month Total Returns | 1 Year Total Returns |
| MSCI Emerging Markets | -1.36% | 24.15% | 24.02% | 44.18% |
| Nasdaq Composite | -2.75% | 21.60% | 13.13% | 29.48% |
| S&P 500 | -0.95% | 15.20% | 10.21% | 22.33% |
| Russell 1000 | -0.50% | 15.14% | 10.33% | 22.02% |
| Russell 2000 | 3.74% | 21.49% | 22.57% | 40.78% |
| MSCI EAFE | 0.09% | 11.08% | 9.84% | 20.80% |
| Dow Jones Industrial Average | 2.71% | 13.38% | 9.76% | 20.65% |
Fixed Income & Treasury Yields
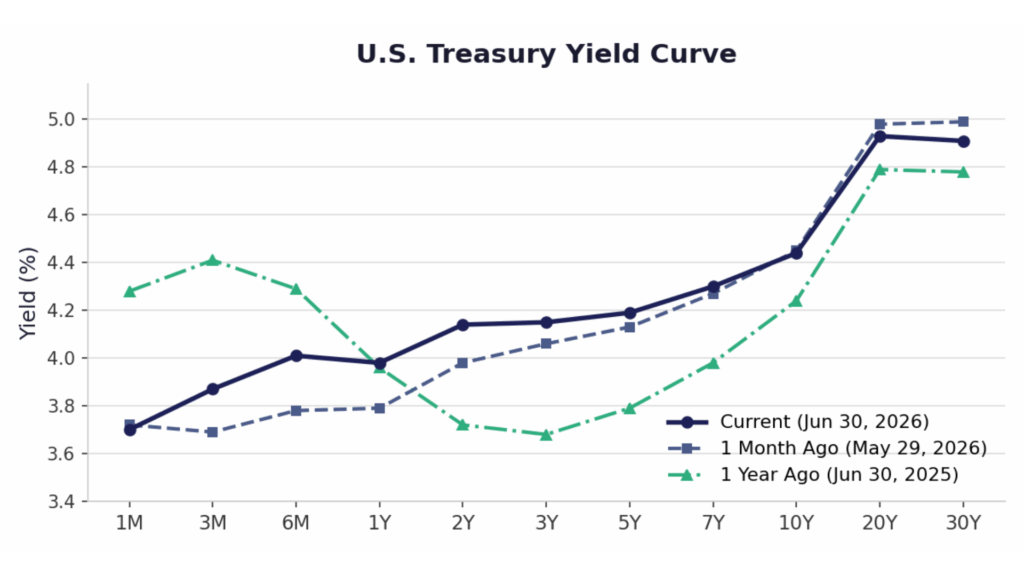
Treasury yields went two directions at once in June. The front end climbed as the market repriced Fed cuts right out of the picture — the 3-month, 6-month, and 1-year rose 18, 23, and 19 basis points, respectively. The long end quietly drifted lower, with the 20-year off 5 bps and the 30-year down 8. The net is a curve that’s repriced sharply higher at the very front while barely budging out long. Bond funds still managed gains across the board, with the iShares 20+ Year Treasury Bond ETF (TLT) leading at +1.2%. The chart below stacks today’s curve against a month ago and a year ago — note how much the entire front end has moved up versus last June, when the Fed was still expected to be cutting.
Macro & Commodity Update
The labor market did the Fed no favors. Payrolls added just 57,000 jobs, roughly half the 115,000 consensus, and labor-force participation slid to a five-year low of 61.8%. Yet the unemployment rate actually ticked down a tenth to 4.2%. The June FOMC left rates at 3.50–3.75% but leaned distinctly hawkish — nine of the eighteen participants now pencil in at least one hike before year-end, up from zero back in March. Read that twice: the dot plot is drifting toward hikes, not cuts.
Inflation is why. Headline CPI rose another 0.4% on the month to 4.2%, the hottest reading since May 2023 and the third straight monthly acceleration. Core firmed to 2.9%. Producer prices are running even hotter, with PPI up to 6.5% year-over-year — a level we haven’t seen since late 2022. The CME FedWatch tool has the July 29 meeting priced as a near-certain hold, around 80% odds, but the market is increasingly sniffing out a possible hike later in the year if these numbers refuse to cool.
On commodities, the flush was broad. Gold’s GLD closed June at $368 after an 11.7% slide, and silver’s SLV was cut nearly 22%. Oil stayed front of mind, but for once in a helpful way — a fragile U.S.–Iran ceasefire framework pulled the risk premium out of crude. Brent finished at $71.59, down 22.9% on the month and a stunning 48% below its early-April high; WTI landed at $71.87. That relief is showing up at the pump, even if the national gas price still sits near $3.96 a gallon.
Crypto didn’t escape the risk-off tone. Bitcoin dropped 18.4% to just above $60,000, and Ethereum fell harder, off 20.3% to around $1,610. Two down months in a row have taken a lot of the froth out of that corner of the market.
Market Outlook – The Second-Half Setup
Heading into the back half, the setup is genuinely unusual: near-record equity indices, a Fed that’s talking about hikes rather than cuts, and inflation that simply won’t sit down. The July 29 FOMC decision looks like a hold, but the real action is in the data that lands first — June CPI on July 14 and June PCE on July 25 will decide whether “possible hike” hardens into “probable.” Two more hot prints and that conversation shifts in a hurry.
The offset is that the earnings backdrop remains supportive. The Street’s mid-year outlooks — from JPMorgan to Schwab to BlackRock — are constructive on equities into year-end, leaning on the AI capex cycle and broadening earnings strength, and Morgan Stanley nudged its S&P 500 target up to 8,000. The risk they all flag is the same one staring back at us from the CPI line: sticky inflation that forces the Fed’s hand and compresses multiples. Layer in still-elevated concentration at the index level and you have a market that can keep grinding higher but has less margin for error than the headline levels suggest.
For clients, the takeaway is the one we’ve been repeating all year — this is a market that pays you to own more than just large-cap U.S. tech. Small caps, international, and emerging markets have carried the first half, and June’s rotation says that dynamic isn’t finished. Stay diversified, keep some dry powder for the CPI-driven air pockets, and don’t chase the tape.
Bottom line: June proved that the “market” and the “index” aren’t the same thing — breadth is broadening, commodities are cracking, and an inflation-wary Fed is the one variable that could rewrite the second-half script.