Year End Review and Outlook
Year in Review 2025
2025 was a volatile year characterized by a violent, policy-driven drawdown followed by an even more aggressive recovery, powered by a mix of tariff relief, better-than-feared fundamentals, and an AI investment wave that kept expanding outward from mega-cap tech.
The Correction
2025 started with a “soft landing” vibe—optimism, solid earnings momentum, and investors positioned for a steady grind higher. That mood didn’t last.
The turning point was President Trump’s “Liberation Day” tariff announcements on April 2, which triggered the S&P 500’s worst two-day performance since March 2020 and kicked off a sharp risk-off move across equities. The Nasdaq took it especially hard, falling 24.15% from its December high.
Markets weren’t just reacting to a headline—they were repricing the economic impact of a broad trade reset. The plan included reciprocal tariffs and a baseline 10% levy across all trading partners, which hit like a sudden tax on margins, confidence, and global growth expectations all at once.
In other words: this wasn’t a slow, fundamentals-only correction. It was the market rapidly repricing a world where trade policy could change quickly, inflation might re-accelerate, and growth could wobble—all at the same time.
The Rebound
The recovery began just as decisively as the correction. On April 8, 2025, President Trump announced a 90-day pause on higher-level reciprocal tariffs to allow negotiations. The key caveat: China was excluded, and tariffs on China were increased to 145%.
Markets took the pause as an immediate reduction in worst-case outcomes—less “policy spiral,” more “negotiation runway.” From the April 8 intraday low to the Dec 31 close, the rebound was huge: the S&P 500 was up ~39.4%.
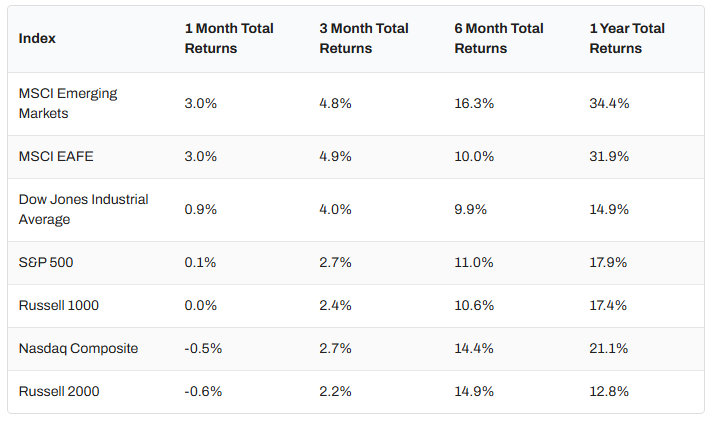
And it wasn’t just large caps that participated. By year-end, U.S. equities finished strong overall: the S&P 500 gained 17.9% in 2025, the Nasdaq rose 21.1%, and the Russell 2000 gained 12.8%. What made the rally stick wasn’t just the policy pivot—it was the way fundamentals refused to roll over.
Solid earnings and high growth drove a pricey US market
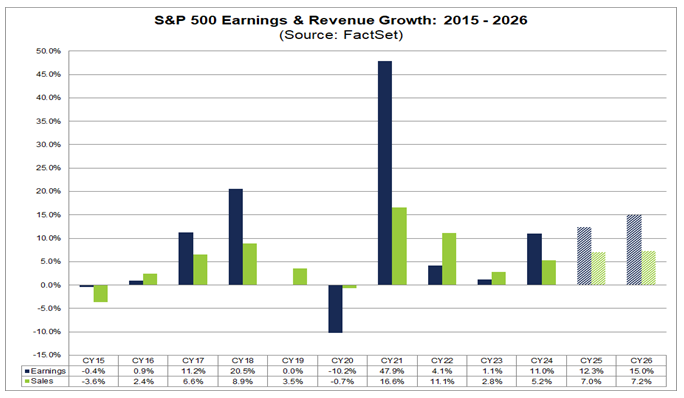
Corporate America delivered a better year than most investors expected, especially given the policy noise. As of mid-December 2025, analysts expect the S&P 500 to report double-digit earnings growth for the second-straight year in CY 2025. The estimated (year-over-year) earnings growth rate for CY 2025 is 12.3%, which is above the 10-year average (annual) earnings growth rate of 8.6% (2015 – 2024). If 12.3% is the final number for the year, it will mark the 5th consecutive year of earnings growth and 2nd consecutive year of double-digit growth. The problem wasn’t earnings—it was the price you had to pay for them.
The forward 12-month P/E expanded to 22.5x by year end, well above the 5-year average (19.9x) and 10-year average (18.4x). To us, that’s not automatically bearish—but it’s a reminder that 2026 returns may depend more on continued execution (and fewer surprises) than on valuation “freebies.”
International markets staged strong comeback
One of the biggest regime shifts in 2025 was international leadership coming back in a big way. Developed (up 31.9%) and emerging markets (up 34.4%) outpaced U.S. equities (up 17.9%) —something investors haven’t been able to rely on for more than a decade. Catalysts included Germany’s €500 billion infrastructure fund and European Central Bank rate cuts, plus a setup supported by currency and valuation dynamics.
The Fed cut rates
The Federal Reserve spent 2025 walking a tightrope: inflation stayed sticky while labor conditions softened. For much of the year, the Fed held the policy rate at 4.25%–4.50%, then started cutting through the fall. At the December 10, 2025 meeting, the Fed delivered another quarter-point cut, bringing the target range to 3.5%–3.75%. But the more important message was tone: December signaled a shift from steady easing to a more cautious “wait-and-see” stance going into 2026.
Translation: policy got more supportive, but not “all clear.” That matters because markets like rate cuts—until they worry the cuts are happening for the wrong reason.
Bond market delivered strong returns
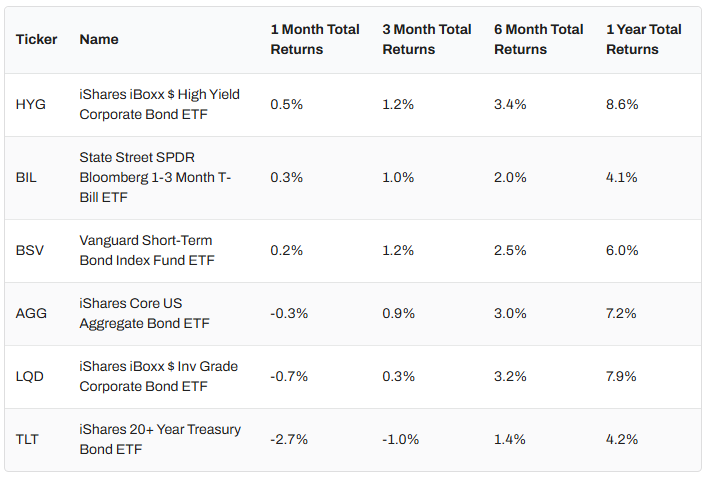
Looking at 12‑month total returns in fixed income, 2025 was a strong year for bonds overall – especially credit. Using the ETFs in the above table as clean benchmarks, high yield (HYG) led the pack at +8.6%, and investment‑grade corporates (LQD) were close behind at +7.9%. The broad core bond market proxy, AGG, returned +7.2%, which is a healthy “core fixed income” outcome and suggests investors were rewarded for staying invested rather than sitting entirely in cash.
The dispersion is telling: short duration beat cash, but long duration didn’t dominate. Short‑term bonds (BSV) gained +6.0%, outpacing T‑bills (BIL) at +4.1%, while long Treasuries (TLT) returned +4.2%, lagging both core bonds and corporate credit. In plain terms, 2025 paid investors most for income plus credit exposure, while the “ultra‑safe/ultra‑long Treasury” corner delivered a more modest result—good, but not the main driver of total return.
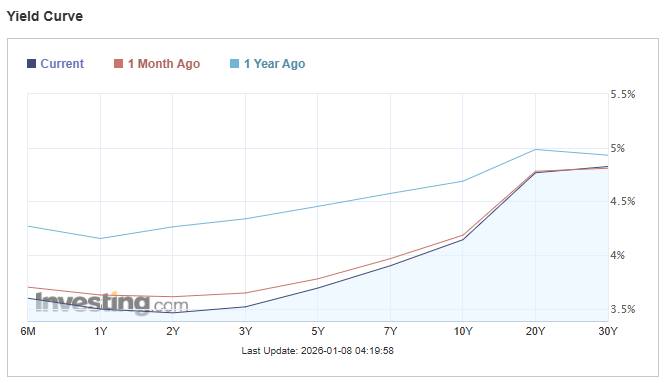
Compared with one year ago, today’s yield curve has shifted meaningfully lower at the front end but only modestly lower at the long end. On the chart, the 6M–5Y part of the curve moved down around ~60–80 bps. By contrast, the 20Y–30Y area is only down ~10–30 bps.
The net effect is a bull steepening: yields fell across the curve, but shorter maturities fell more than longer maturities, so the curve is steeper/ more “normally” upward sloping than it was a year ago. In practical terms, the market is pricing a path where policy rates drift lower (pulling down short yields), while long-term rates remain relatively sticky—suggesting investors still demand a decent term premium for inflation uncertainty, fiscal supply, and duration risk even as the front end improves.
AI remains a dominant theme
AI was the dominant stock market theme of 2025 because it wasn’t just a story – it was a capex cycle. All year, companies kept revising AI infrastructure plans higher, which pulled investor attention (and dollars) toward anything tied to chips, networking, data centers, storage, and the power stack that keeps those facilities running. Research and market commentary throughout the year consistently pointed to hyperscalers spending north of $350B in 2025 capex, with “AI buildout” being the core driver.
And the market rewarded the picks-and-shovels providers: even outside the usual mega-cap winners, parts of the hardware and storage ecosystem had standout runs as demand for AI-related infrastructure surged.
What made the AI trade unusually durable in 2025 is that the earnings math backed it up. Per FactSet’s calendar-year 2025 earnings preview, three of the top five contributors to S&P500’s earnings growth were Magnificent 7 names—NVIDIA, Alphabet, and Amazon—and analysts expected the Magnificent 7 to deliver ~22% earnings growth versus about ~9% for the other 493 companies.
That gap explains why the market stayed so anchored to AI leadership: the profit engine was real, but it also meant expectations got heavy and concentration risk stayed front-and-center. In other words, the market’s AI bet wasn’t “no earnings, all hope.” It was “big earnings, bigger expectations”—and that’s exactly why any wobble in AI spend, margins, or ROI became one of the most important things investors watched as 2025 closed.
Gold played defense; crypto stayed messy
Gold had a monster year—up about 64% in 2025—and behaved like the market’s preferred “policy hedge” asset, supported by dollar weakness, inflation anxiety, geopolitics, and strong institutional/central bank demand. Crypto was the opposite side of the risk spectrum. Bitcoin finished 2025 down a little over 6% and remained highly volatile—especially when macro/policy headlines drove broad risk-off behavior.
The message from markets was pretty blunt: in 2025, when investors wanted protection, they chose gold, not “high beta.”
Bottom Line
2025 reminded everyone that policy can still move markets fast, but it also showed how powerful earnings resilience + AI capex can be once the macro panic fades. The setup heading into 2026 is constructive—but with higher expectations, pricier multiples, and a much bigger premium on selectivity than “buy the index and forget it.”
Market Outlook for 2026
Looking ahead to 2026, we expect the U.S. stock market to continue its positive performance following three strong years of double-digit gains. There are three key factors we believe will shape the performance of both stocks and bonds moving forward.
Earnings growth to sustain driven by AI
We see a real path for S&P 500 earnings growth to sustain as AI shifts from “building the rails” (chips, cloud, data centers, power) to “using the rails” (productivity gains that expand margins across a wider set of industries). The Magnificent 7 have already been doing the heavy lifting—2025 earnings growth is expected around ~22% for the group vs. ~9% for the other 493 companies—so the next leg is about those AI benefits broadening beyond the mega-caps. Current consensus calls for S&P 500 earnings growth to rise from ~12% in 2025 to ~15% in 2026, and that optimism is big reason equity valuations look elevated versus history.
At the same time, the U.S. economy is running into a very practical constraint: labor scarcity. With unemployment around 4.5%, many industries are still operating in a tight labor market where growth becomes harder simply because hiring enough people is hard and expensive. AI offers a credible solution—not by replacing the workforce overnight, but by lifting productivity of existing workers by ~10–20%, allowing companies to scale output with less dependence on net new headcount. That’s a meaningful macro lever: higher productivity is one of the few ways to grow faster without needing millions of additional workers.
The U.S. is also unusually well positioned to monetize this shift because the ROI math is cleaner here: labor costs are high (~$45/hour for private-sector workers including benefits), while capital and energy costs are relatively more favorable than in many peer markets. The prize is enormous—globally, the white-collar labor market is estimated to be around $30 trillion annually, roughly 100x the size of the $300 billion enterprise software market—so even modest penetration can create outsized economic impact. For U.S. multinationals, AI has clear line-of-sight to automating and augmenting labor-heavy functions like sales, marketing, finance, customer service, operations, software engineering, and HR, driving efficiency, scalability, and a multi-year uplift in corporate profitability.
Rate cut to push more cash into bonds and stocks
Money-market funds became the “default asset class” for a lot of investors once cash yields jumped above 5% in 2023—and the pile of sidelined liquidity is still enormous. As of the week ended Dec. 30, 2025, U.S. money market fund assets were about $7.73T according to ICI. But yields are already drifting lower: Morgan Stanley/Crane data show average money-fund yields around ~3.6% in early January 2026, down from 5%+ in 2023.
If the Fed continues easing in 2026, “cash” becomes less compelling, and even a modest rotation out of money funds can create meaningful incremental demand for bonds and equities. The catalyst is simple math: when policy rates fall, investors start looking for ways to lock in yield (bonds) or re-risk for return (stocks). That dynamic may be amplified by the Fed leadership transition in May 2026—markets have already been betting that Powell’s successor could be more dovish, which would increase the probability of additional cuts once the new chair is in place (even if outcomes still depend on the full committee and the data).
Lower rates also work through the real economy: as borrowing costs and the cost of capital come down, pent-up demand tends to reappear – especially in categories where purchases are often financed (housing, autos, appliances, solar, and business equipment). That’s typically when cyclical and other rate-sensitive areas can start to improve as investors front-run a recovery.
Downside risks include elevated valuation and AI execution
The two biggest near-term risks for the stock market are elevated valuations and AI execution. On valuation, the S&P 500 is trading around ~22.5x forward 12‑month earnings, which is well above the 5‑year average (19.9x) and 10‑year average (18.4x), according to FactSet. The message is simple: the market is already pricing in solid earnings delivery, so there’s less room for “good, not great”—any earnings hiccup or guidance wobble can show up quickly as multiple compression.
That leads directly to the second risk: AI execution. The 2025 AI capex wave was powerful, but the next phase requires clear proof of ROI—durable monetization, sustained margin expansion, and measurable productivity gains, not just bigger buildouts. Key downside scenarios include overbuild (capacity ramps faster than paying demand), a monetization lag (adoption rises but pricing doesn’t), or margin pressure (depreciation, power costs, competition). With expectations already high, even a modest shift in AI spending plans or management tone on returns could trigger earnings revisions and a sharp de-risking—especially in crowded positions.